With an abundance of market information literally at investors’ fingertips, the price/earnings ratios of publicly traded companies are easier than ever to find but often more difficult to interpret. In fact, knowing the P/E ratio of a single company, a basket of stocks, or the overall market may not be particularly helpful unless you are in a position to make meaningful comparisons.
Put simply, the P/E ratio is calculated by dividing a stock’s current price per share by the company’s earnings per share over a 12-month period. It quantifies what investors may be willing to pay for one dollar of earnings. Thus, a P/E ratio of 10 means that investors would pay $10 for every $1 the company earns.
P/E ratios may serve as a better indicator of a stock’s underlying value than the market price alone, but it’s essential for investors to understand what they represent.

Two Ways to Express Earnings

The trailing P/E, which is the ratio most commonly referenced, relies on the officially reported earnings per share for the previous four quarters. The forward P/E is calculated using the expected earnings over the next four quarters, which can end up differing substantially from the actual figure because it relies on analysts’ projections.

Weighing Price vs. Value

A relatively high P/E ratio may signal greater optimism in the stock’s growth potential. Investors expect the company’s earnings to grow more quickly and are prepared to pay more for the stock. But if future earnings disappoint, the price could fall rapidly.
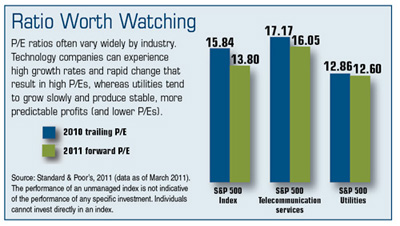
A lower P/E ratio may suggest that a company’s earnings are more stable and predictable, but investors may not be willing to pay as much for the stock. There is usually less chance that the company will surprise the market with a strong jump in earnings that could cause the stock price to rise dramatically, or a drop in earnings that could cause the stock price to fall significantly.
By this standard, a stock that costs $10 per share with a P/E of 50 would typically be considered more “expensive” than a stock with a $50 share price and a P/E of 10. But it’s not as simple as comparing the P/E ratios of two different companies to determine which one may be a better value.

The Benefit of Perspective

Although it would rarely make sense to compare the P/E ratio of a tech stock to one of a utility stock, weighing the P/E ratios of two companies in the same industry may provide some insight. Furthermore, viewing one company’s P/E in light of the industry average or its own historical norms may also offer clues about the potential of a stock investment.
The return and principal value of stocks fluctuate with changes in market conditions. Shares, when sold, may be worth more or less than their original cost.
Looking closely at P/E ratios is just one of many ways to evaluate stock investments, but there are many reasons why a company’s P/E ratio may seem relatively high or low. Buy and sell decisions should typically be made with more than one factor in mind.
The information in this article is not intended as tax or legal advice, and it may not be relied on for the purpose of avoiding any federal tax penalties. You are encouraged to seek tax or legal advice from an independent professional advisor. The content is derived from sources believed to be accurate. Neither the information presented nor any opinion expressed constitutes a solicitation for the purchase or sale of any security. This material was written and prepared by Emerald. © 2011 Emerald Connect, Inc.
Click here for more Newsletters. Thank you.

Miami FL, Charleston SC, Atlanta GA, Charlotte NC - Investments & Insurance.

Contact Us

Hedges Wealth Management LLC - A Registered Investment Adviser
Hedges Insurance Agency LLC
1300 Appling Drive #201 | Mt Pleasant | SC 29464
 +1 843 270 2534 | F 704 919 5946

If you are looking for more information any subject in this Blog, please Contact Us directly electronically or via phone. Thank you.

www.hedgeswealthmanagement.com


Despite the pick-up in volatility at the end of January, risk assets continued their upward ascent throughout the month. Expectations surrounding the implementation of the newly passed tax reform bill and the weakening US dollar served as positive catalysts for the month. Macroeconomic data was mixed; fourth quarter real GDP growth came in slightly below expectations but manufacturing activity accelerated and the US jobs report was positive. Although we have seen initial signs of rising inflation, levels remain subdued as low unemployment has yet to translate into meaningful wage growth. We expect the Federal Reserve (Fed) to remain on track with interest rate normalization and the positive, albeit choppy, market momentum we have seen to date indicates that markets can likely withstand an additional Fed rate hike in March.
The S&P 500 Index was up 5.7% for the month with cyclicals outperforming defensive sectors. Consumer discretionary (+9.3%) led while tax cuts and a solid job market served as positive catalysts. Information technology (+7.6%) and financials (+6.5%) also posted strong returns for the month. Utilities (-3.1%) and REITs (-2.0%) were down as traditional bond proxy sectors experienced headwinds amidst rising interest rates. Growth outperformed value and large-cap outperformed both mid-cap and small-cap equities.
Developed international equities (+5.0%) performed in line with domestic equities. Fundamentals within the Eurozone continued to improve and sentiment is high. The focus remains on European Central Bank policy and how the reduction of its quantitative easing purchases will impact markets. Emerging markets were up 8.3%. A weaker dollar and stronger demand for commodities served as tailwinds for both emerging Asia and Latin America regions.
Feb. 2018 Market Outlook
The Bloomberg Barclays US Aggregate Index was down -1.2% for the month. Interest rates surged with 10-year Treasury yields increasing 31 basis points, ending the month at 2.7%. Tightening monetary policy and improving US growth expectations will likely continue to put upward pressure on the long end of the yield curve. High yield was the only sector to post positive returns in January, as credit spreads continued to grind tighter. Like taxable bonds, municipals were negative for the month.
We remain positive on risk assets over the intermediate-term, although we acknowledge we are in the later innings of the bull market and the second half of the business cycle. While this cycle has been longer in duration compared to history, the recovery we have experienced has been muted, supported by the extended recovery period. While our macro outlook is biased in favor of the positives, the risks must not be ignored.
We find a number of factors supportive of the economy and markets over the near-term.
  • Pro-growth policies of the Administration: The Trump administration has delivered a new tax plan and a more benign regulatory environment. We could see additional government spending on infrastructure in 2018.
  • Synchronized global economic growth: Growth in the US has started to accelerate, and growth in both developed international and emerging economies has meaningfully improved. The tax cuts could also help to boost GDP growth in 2018.
  • Improvement in earnings growth: Corporate earnings growth has improved globally and corporate tax reform should further benefit US-based companies.
  • Elevated business sentiment: Measures like CEO Confidence and NFIB Small Business Optimism are at elevated levels. This typically leads to additional project spending and hiring, which should boost growth. The corporate tax cut should also benefit business confidence and lead to increased capital spending.
However, risks facing the economy and markets remain, including:
  • Fed tightening: The Fed will continue to tighten monetary policy, with at least three interest rate hikes priced in for 2018. We may see tightening from other global central banks as well.
  • Higher inflation: Current levels of inflation are muted but inflation expectations have ticked higher and the reflationary policies of the Administration could further boost levels. Should inflation move higher, the Fed may shift to a more aggressive tightening stance.
  • Geopolitical risks: Geopolitical risks including trade policies and global challenges could cause short-term market volatility.
Despite the volatility experienced over the last week, the technical backdrop of the market remains favorable, credit conditions are supportive, and global economic growth is accelerating. So far President Trump’s policies are being seen as pro-growth, and business and consumer confidence are elevated. The onset of new policies under the Trump administration and actions of central banks may lead to higher volatility, but our view on risk asMarchsets remains positive over the intermediate-term. Higher volatility can lead to attractive pockets of opportunity we can take advantage of as active managers.
Brinker Capital Barometer (as of 1/5/18)
Brinker_Barometer_1-5-18


Source: Brinker Capital. Leigh Lowman, CFA, Investment Manager. Views expressed are for informational purposes only. Holdings subject to change. Not all asset classes referenced in this material may be represented in your portfolio. Indices are unmanaged and an investor cannot invest directly in an index. All investments involve risk including loss of principal. Fixed income investments are subject to interest rate and credit risk. Foreign securities involve additional risks, including foreign currency changes, political risks, foreign taxes, and different methods of accounting and financial reporting. S&P 500: An index consisting of 500 stocks chosen for market size, liquidity, and industry grouping, among other factors. The S&P 500 is designed to be a leading indicator of US equities and is meant to reflect the risk/return characteristics of the large-cap universe. Companies included in the Index are selected by the S&P Index Committee, a team of analysts and economists at Standard & Poor’s. Bloomberg Barclays US Aggregate: A market capitalization-weighted index, maintained by Bloomberg Barclays, and is often used to represent investment grade bonds being traded in United States.
Views expressed are those of Brinker Capital, Inc. and are for informational/educational purposes.  Opinions and research referring to future actions or events, such as the future financial performance of certain asset classes, indexes or market segments, are based on the current expectations and projections about future events provided by various sources, including Brinker Capital’s Investment Management Group. Information contained within may be subject to change. Diversification does not assure a profit not guarantee against a loss.
The information in this article is not intended as tax or legal advice, and it may not be relied on for the purpose of avoiding any federal tax penalties. You are encouraged to seek tax or legal advice from an independent professional advisor. The content is derived from sources believed to be accurate. Neither the information presented nor any opinion expressed constitutes a solicitation for the purchase or sale of any security. This material was written and prepared by Hedges Wealth Management.
 
Click here for more Newsletters. Thank you.
 
Miami FL, Charleston SC, Atlanta GA, Charlotte NC - Tax, Financial Planning, Investments and Insurance.

Loading