 With an abundance of market information literally at investors’ fingertips, the price/earnings ratios of publicly traded companies are easier than ever to find but often more difficult to interpret. In fact, knowing the P/E ratio of a single company, a basket of stocks, or the overall market may not be particularly helpful unless you are in a position to make meaningful comparisons.
Put simply, the P/E ratio is calculated by dividing a stock’s current price per share by the company’s earnings per share over a 12-month period. It quantifies what investors may be willing to pay for one dollar of earnings. Thus, a P/E ratio of 10 means that investors would pay $10 for every $1 the company earns.
P/E ratios may serve as a better indicator of a stock’s underlying value than the market price alone, but it’s essential for investors to understand what they represent.
Two Ways to Express Earnings
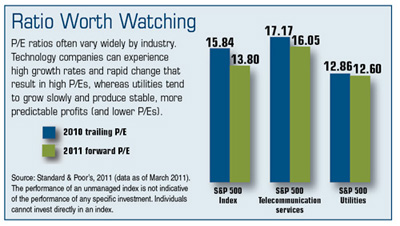
The trailing P/E, which is the ratio most commonly referenced, relies on the officially reported earnings per share for the previous four quarters. The forward P/E is calculated using the expected earnings over the next four quarters, which can end up differing substantially from the actual figure because it relies on analysts’ projections.
Weighing Price vs. Value
A relatively high P/E ratio may signal greater optimism in the stock’s growth potential. Investors expect the company’s earnings to grow more quickly and are prepared to pay more for the stock. But if future earnings disappoint, the price could fall rapidly.
A lower P/E ratio may suggest that a company’s earnings are more stable and predictable, but investors may not be willing to pay as much for the stock. There is usually less chance that the company will surprise the market with a strong jump in earnings that could cause the stock price to rise dramatically, or a drop in earnings that could cause the stock price to fall significantly.
By this standard, a stock that costs $10 per share with a P/E of 50 would typically be considered more “expensive” than a stock with a $50 share price and a P/E of 10. But it’s not as simple as comparing the P/E ratios of two different companies to determine which one may be a better value.
The Benefit of Perspective
Although it would rarely make sense to compare the P/E ratio of a tech stock to one of a utility stock, weighing the P/E ratios of two companies in the same industry may provide some insight. Furthermore, viewing one company’s P/E in light of the industry average or its own historical norms may also offer clues about the potential of a stock investment.
The return and principal value of stocks fluctuate with changes in market conditions. Shares, when sold, may be worth more or less than their original cost.
Looking closely at P/E ratios is just one of many ways to evaluate stock investments, but there are many reasons why a company’s P/E ratio may seem relatively high or low. Buy and sell decisions should typically be made with more than one factor in mind.
The information in this article is not intended as tax or legal advice, and it may not be relied on for the purpose of avoiding any federal tax penalties. You are encouraged to seek tax or legal advice from an independent professional advisor. The content is derived from sources believed to be accurate. Neither the information presented nor any opinion expressed constitutes a solicitation for the purchase or sale of any security. This material was written and prepared by Emerald. © 2011 Emerald Connect, Inc.
Miami FL, Charleston SC, Atlanta GA, Charlotte NC - Investments & Insurance.
Contact Us
Hedges Wealth Management LLC - A Registered Investment Adviser
Hedges Insurance Agency LLC
1300 Appling Drive #201 | Mt Pleasant | SC 29464
T | F 704 919 5946
If you are looking for more information any subject in this Blog, please Contact Us directly electronically or via phone. Thank you.
www.hedgeswealthmanagement.com
If you are looking for more information any subject in this Blog, please Contact Us directly electronically or via phone. Thank you.
www.hedgeswealthmanagement.com